Application Software Performance Under the Microscope
Nils Keller, Partner at IMAP Germany takes a deep dive into the Application Software market for Creating Value, providing analysis on its development throughout 2022, with special emphasis on stock market valuations and M&A activity.

NILS KELLER
Partner
IMAP Germany
nils.keller@imap.de
Our sector experts at IMAP Germany covering the Software market follow closely the performance of listed companies in this segment. To assess such a broad market, we make a distinction between application-oriented software solutions, for both horizontal or vertical applications, and general IT and software solutions, which are either functional focused software solutions, business model focused, or size-wise focused software companies.
Historic Growth, Stock Market Performance, and Valuations
Horizontal application software is used across industries and does not generally require market or industry specific customization, rather it is business process focused. We focus on a sample of horizontal-sub-groups, providing Customer- Relationship-Management Software (CRM) , Enterprise-Resource-Planning Software (ERP), Telecommunications-Software, as well as Supply- Chain-Management (SCM) and Logistics Software.
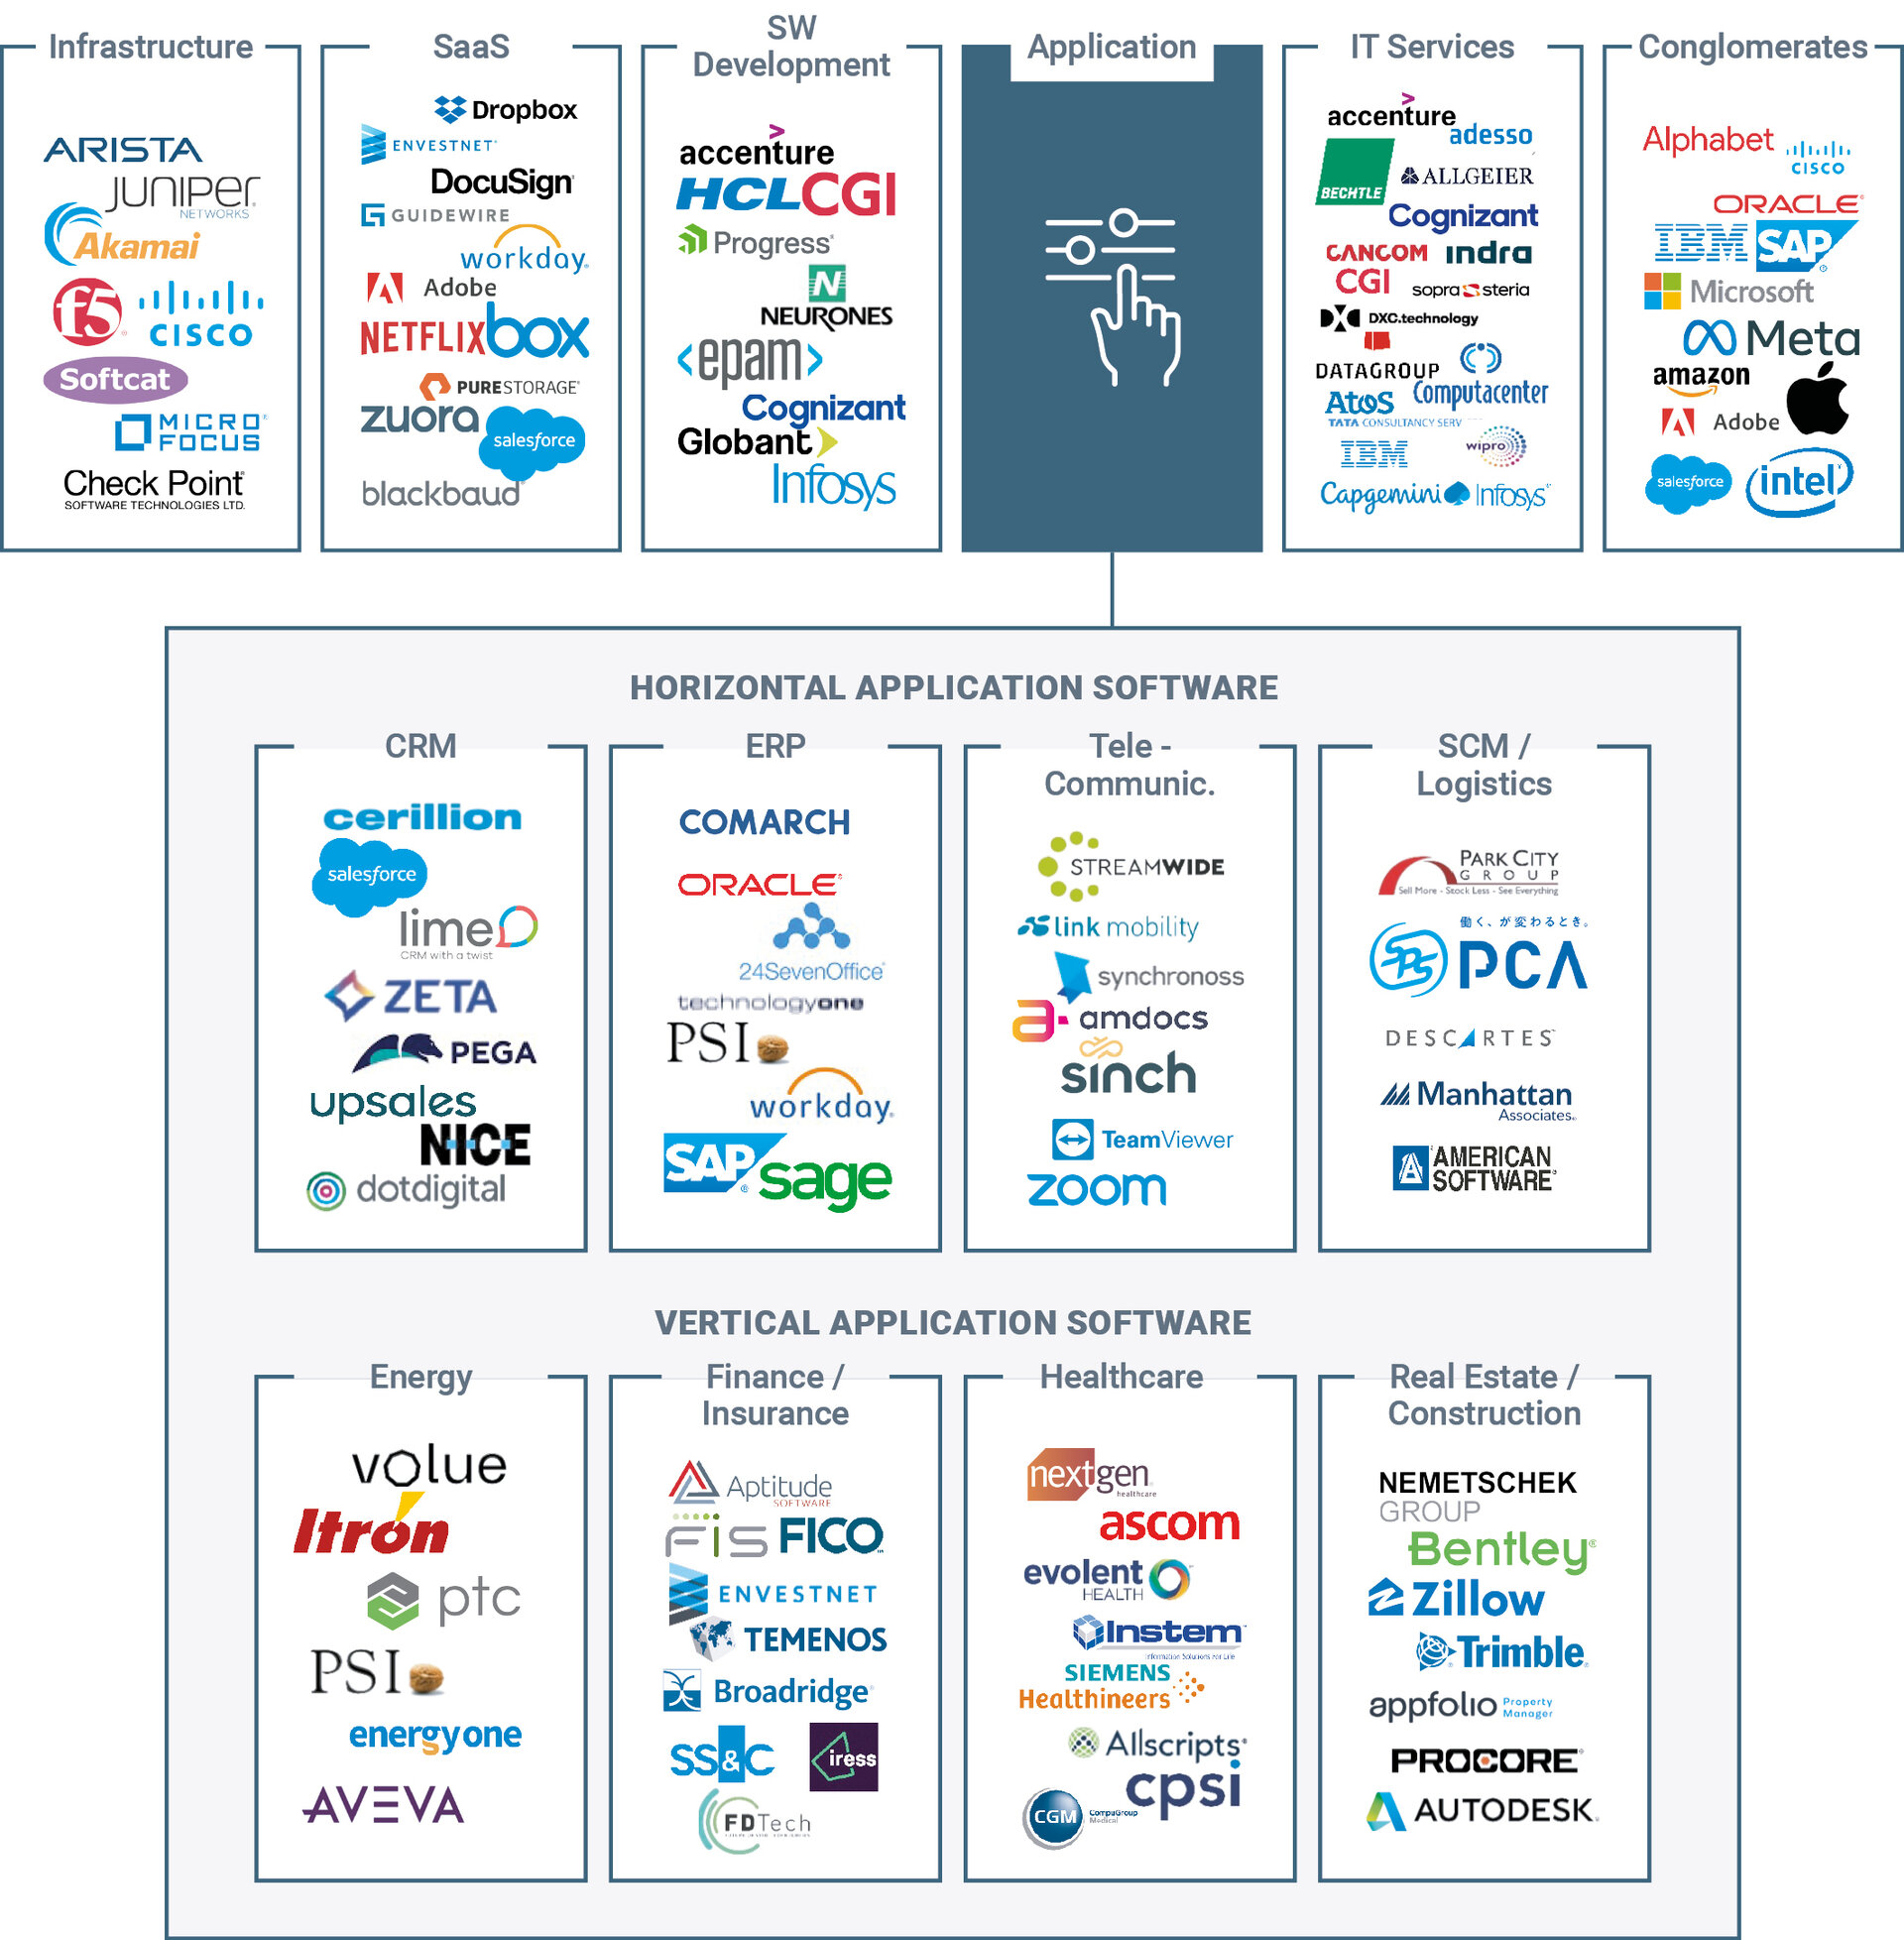
The following graph illustrates the different software sub-groups that we define:

Progressive digitization as well as efficiency enhancement and cost-cutting measures have contributed to strong growth for the Horizontal Application Software market in recent years, which was reflected in higher valuations and favorable stock market performance. However, due to the overall economic headwinds and rising interest rates, as well as the expiry of lock-down profits, providers have seen a strong decline in the past 12 months, especially in the CRM and Tele-/Communications segments.
Within the vertical-sub-groups, we focus on the following industries: Energy, Finance, Insurance, Healthcare, Real Estate, and Construction. In addition to global megatrends such as advancing digitization, industry-specific drivers and trends have a major influence on the respective vertical application software segment meaning they cannot be generalized across the industries. That being said, over the last 12 months, most vertical software applications providers faced headwinds and declining share prices, with very few exceptions.
Stock-Market Performance
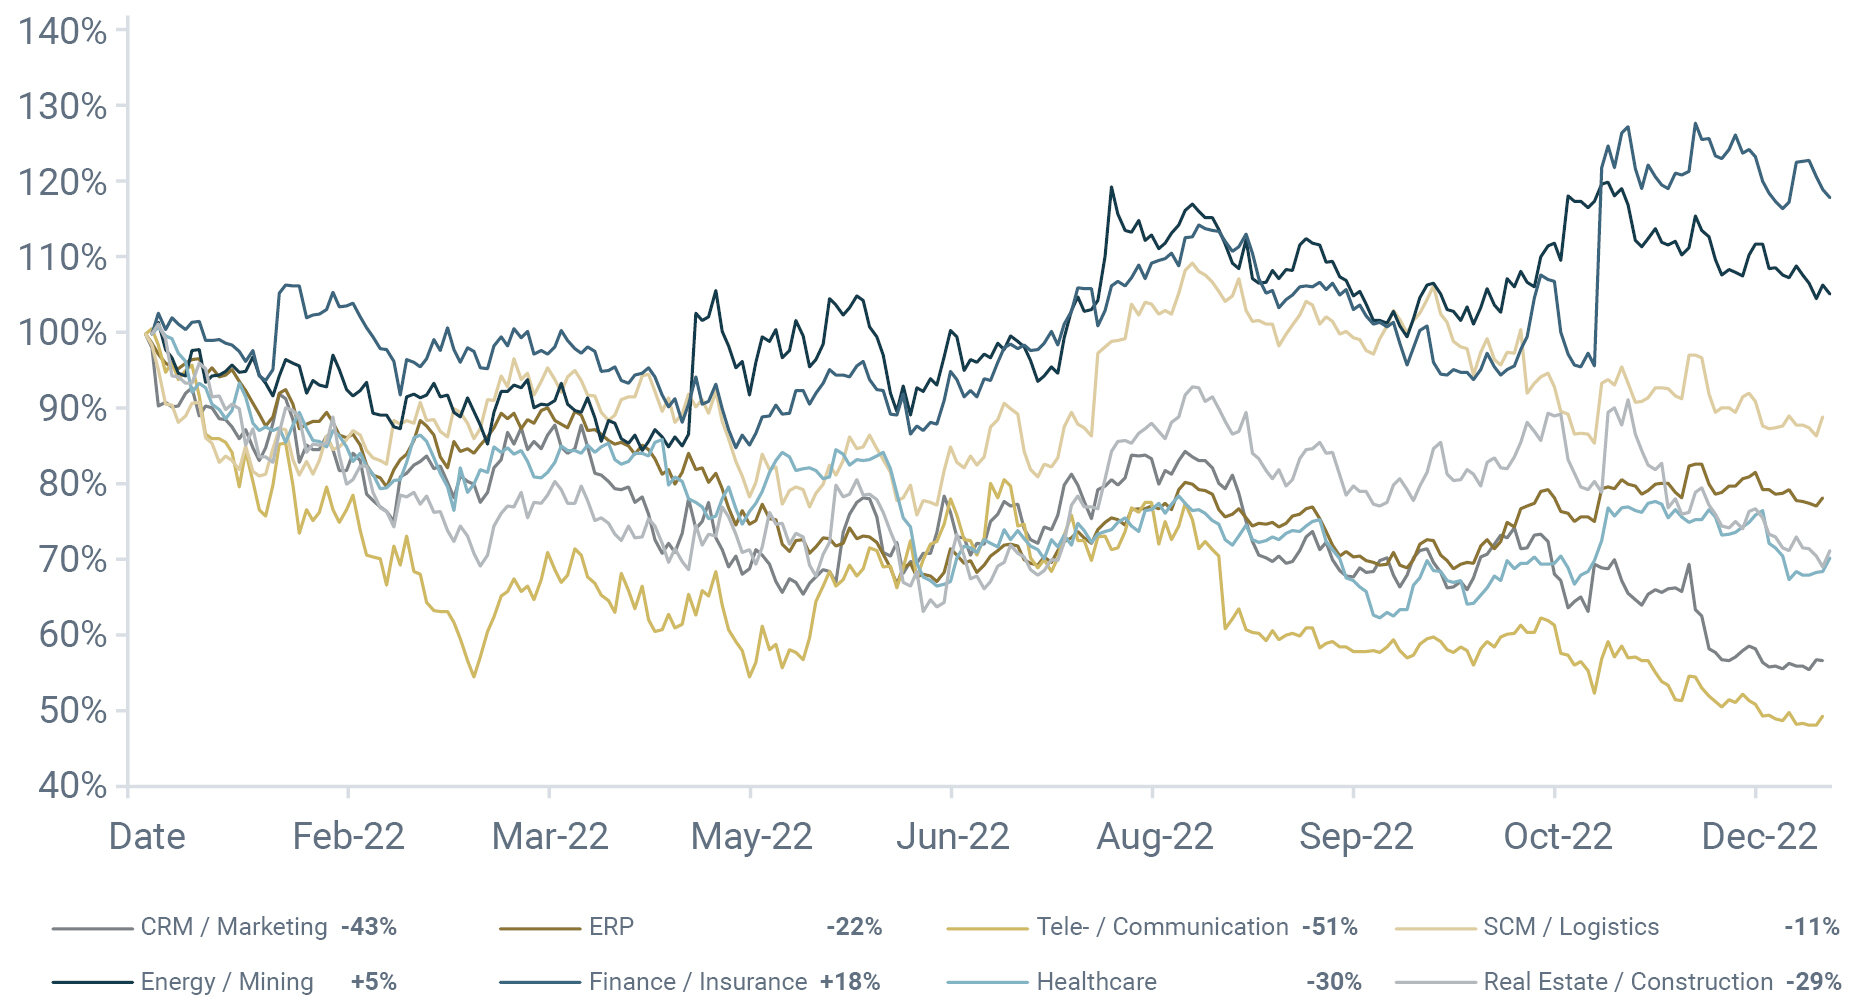
In 2022, all segments of horizontal application software saw declining share prices1, with losses ranging between -11% on the low end, and up to -51% on the high end. If we look at CRM/Marketing and Tele-/Communications, we saw just one stock increase in each in 2022, whereas the remaining individual stocks all lost value. Individual stock performance within the ERP and SCM sectors on the other hand, remained consistent.
If we look at the development of the vertical application software sub-groups, however, we see very varied stories (results again driven by individual stock performance):
- Energy – Gained 5%. Within the segment, only shares of PTC gained 6% in 2022, which resulted, thanks to its high share price compared to others, in the sub-segment's overall gain
- Finance – Gained 18%. Thanks to a gain of 47% in the shares of Fair Isaac Corporation leading to this segment’s overall positive performance. The remaining shares lost between -56% and -17%
- Healthcare – Lost c. 30%. Two of the sector’s heavyweights, CompuGroup and Siemens Healthineers lost 47% and 28% respectively, whereas Evolent and NextGen Healthcare in turn, gained 8% and 13%
- Real Estate – Lost c. 30%. All stocks from the Real Estate sub-segment lost in value
The following graph illustrates the stock performance of our eight defined sub-groups of application software in the last twelve months ending December 2022:

Share prices fell, in light of the imminent interest rate hikes starting at the end of 2021 and before interest rates in fact increased from early 2022 onwards. As software company valuations depend to a large degree on future earnings, higher interest rates lead to higher discount factors, and thus negatively impact the intrinsic present values. The horizontal application sub-groups are predicting top-line growth rates for the next three years, between 8-22% on a year-on-year basis, driven strongly by their future expectations.
However, if we look at vertical applications, the outlook is more varied, with growth rates ranging between 5-18%.
Furthermore, the performance of individual stocks/companies have a clear impact on the sub-group’s performances, as the indexes are calculated price-weighted. PTC Inc. e.g. showed a strong performance with a 6% growth of its share price, following a topline growth or more than 20% in 2022 YOY.

At the same time, financial software provider FICO saw a very strong topline growth in 2022 with +20%, which resulted in its 47% share price gain.
In addition to evaluating stock price performance, it is important to analyze the development of the underlying relative valuations of these companies, as this serves as a comparable valuation method for private mergers & acquisition targets.
Relative Valuations Declining
In relation to stock price developments, the underlying relative valuations of our application software sub-groups showed a declining trend during 2022. Relative valuations are derived from Enterprise Value (EV) which is put in relation to expected revenues or earnings (EBITDA). This value varies with actual or expected changes in the numerator and denominator.
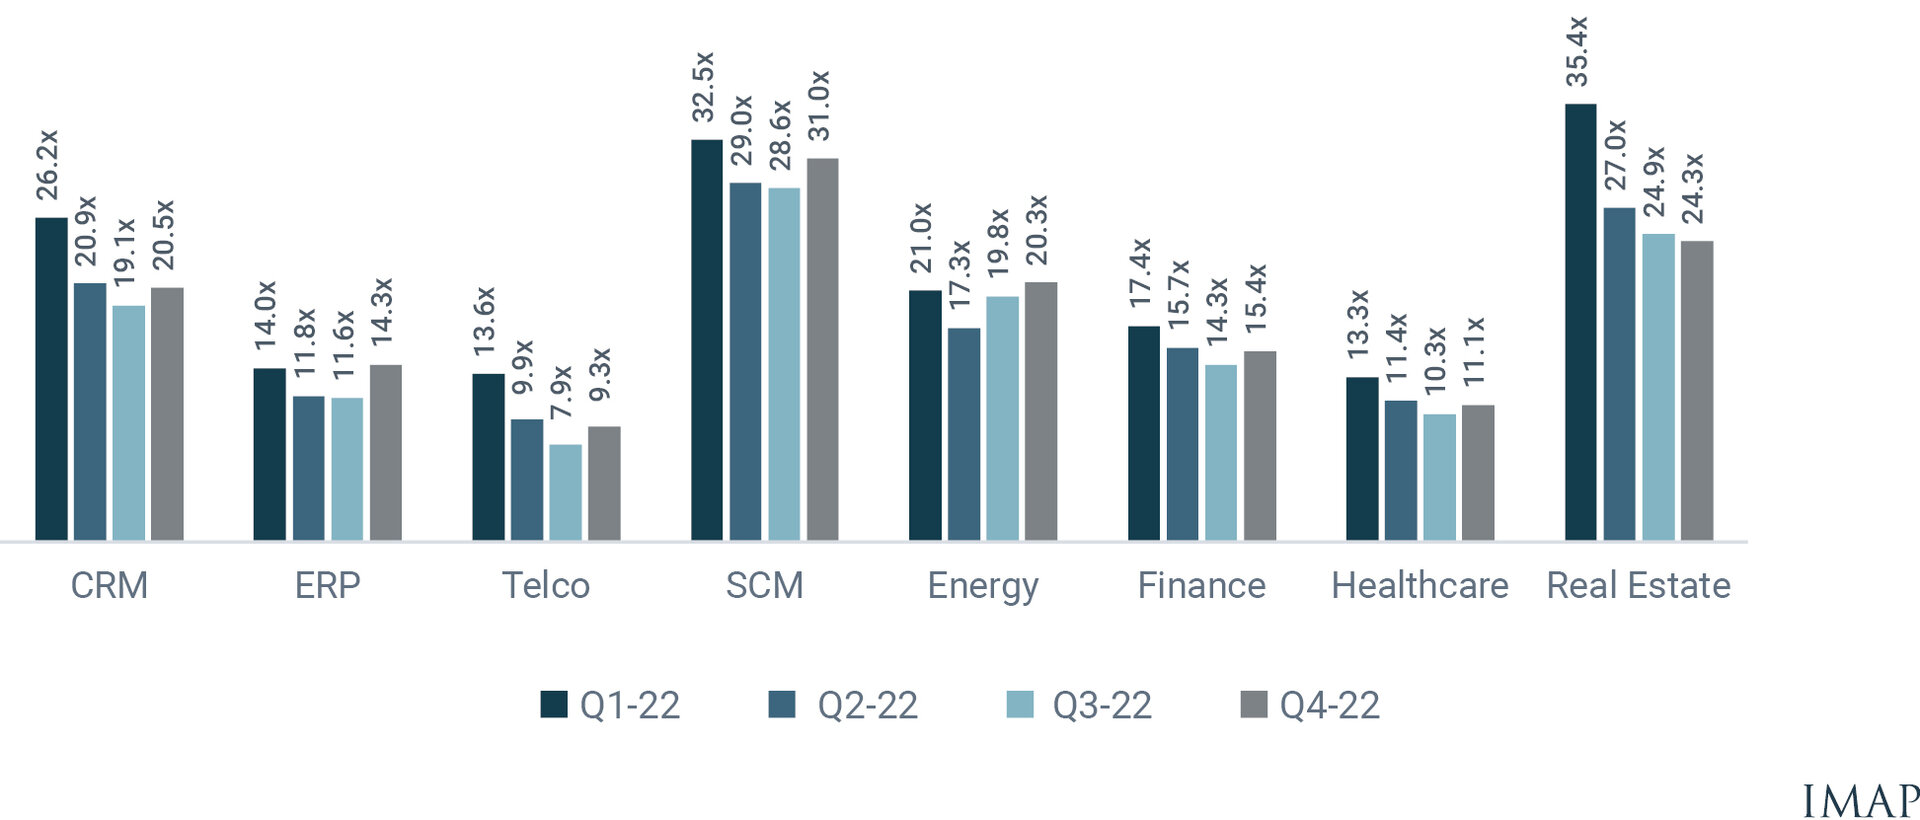
When comparing EV to the expected results for the respective year (in this case FY22e), we saw a downward trend in the first three consecutive quarters, and a stabilization towards year end. For example, software companies from our CRM sub-group were trading at an FY22E EBITDA of 26x in Q1-22, which decreased to 20.5x by year end. The main driver for this being the decreasing numerator or Enterprise Value, as the share prices weakened.
To capture a more sustainable view on the development of relative valuations, we also look at the median NTM (next-twelve-months)-EBITDA multiples, as these show any cyclicality in the valuation of the respective sub-groups.
The following graph illustrates the development of FY22E EV/EBITDA multiples on a quarter-by-quarter comparison:

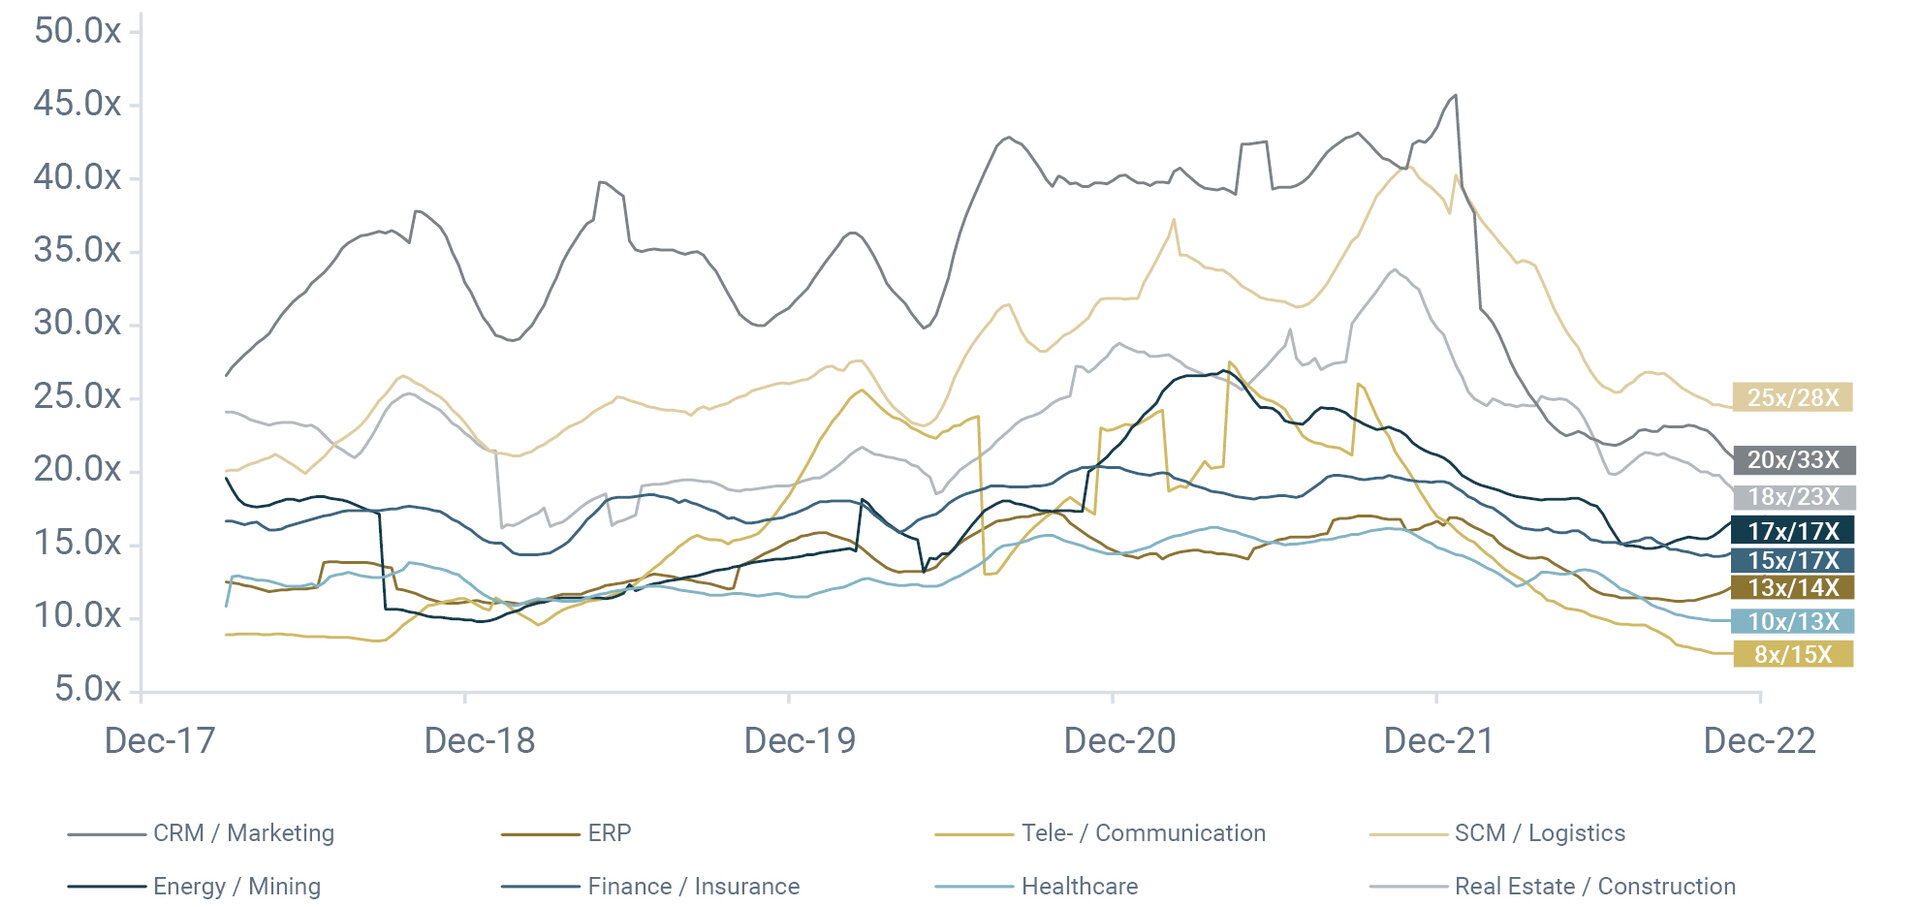
As can be seen in the following graph, the first figure indicates the latest NTM-EBITDA-multiple as of Q4-22, and the second figure the 5-year median. Seven of the eight sub-groups are trading below their 5-year median values with only the Energy vertical at exactly its median value.
Despite application software providers focused on Energy, the SCM, Finance and ERP sub-segments are also only valued between 8% to 12% below their 5-year median values. Software providers focused on Telecommunications and Real Estate are valued more than 40% below their 5-year median values.
The following graph illustrates the NTM-EBITDA multiples (next-twelve-months) over a five-year horizon:

European M&A Deal Activity and Valuations
When looking at M&A deal activity in Europe in 20222, we can see that according to Mergermarket, 851 deals with European targets in the application software segment took place. Furthermore, 335 deals reported their values with a total deal value of nearly €54 billion and a median value of c. €37 million. The median multiples paid amount to c. 4.4x3 EV/revenues and 15.6x2 EV/EBITDA respectively.
M&A Activity Over the Next 12 Months
As economic growth is slowing, the risk of falling into a recession is rising in many economies of the world and further expected interest rate hikes might also dampen the stock market recovery for some time. On the other hand, Gartner is predicting that IT spending will rise by more than 6% in 2023, as companies intend to predict demand, track their supplies, and secure their data. Furthermore, automation is likely to increase to counter challenges such as rising wages and employee shortages. The impending retirement of the boomer generation also underlines the need to digitize the knowledge and experience side of business processes, so as not to lose key knowledge in the coming years. Some experts thus foresee the potential for stock prices of technology companies to pick up by up to +20% again in 2023.
The rising cost of capital will also enable strategic buyers to realign valuation offers by financial investors and re-enter the stage more dominantly
In terms of M&A, we expect an active year once again, as the underlying growth drivers for many software companies remain intact, and the valuation gap looks to disappear. Following the reset in public valuations in 2022, the mark down of M&A valuations, which tends to lag, will bottom-out in 2023. The rising cost of capital will also enable strategic buyers to realign valuation offers by financial investors and re-enter the stage more dominantly. Due to the weaker valuation environment, it is likely we will see an increase in stake sales (minority stakes, or at least significantly less than 100%) whereby sellers will attempt to recapture higher valuations for the remaining shares at a later date and more favorable valuation environment. According to Mergermarket’s heat chart, which tracks opportunities based on “companies for sale” intelligence, the TMT sector remains the hottest sector in almost all regions for the time being.
